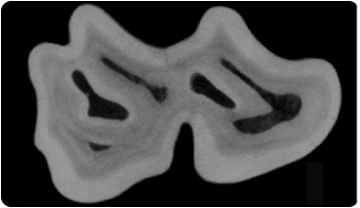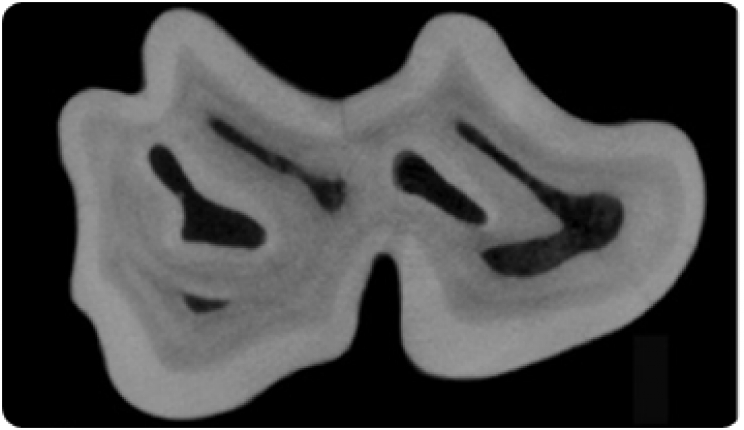
Tooth cross section of one of the analised micrommamals, Ruscinomys schaubi. Approximate tooth size: 3x2 mm.
Van Dam and Fortuny are researchers at the Institut Català de Paleontologia Miquel Crusafont (ICP), close to Barcelona. Van Ruijven from the Academic Centre for Dentistry in Amsterdam (ACTA) is expert on microCT scanning, that is computed tomography scanning of small objects (smaller than a few cm). Usually tomography research is linked to human illnesses, but at ICP it is used to extract information hidden in the shape and the structure of fossils. One important challenge is to express the shape and structure of a tooth in a few parameters only, in order to classify the animals according to what they ate millions of years ago. Hypsodonty (or relative crown height) and proportion of enamel are two very useful parameters indicating diet. Until now, palaeontologists have measured hypsodonty by simple length, width and height dimensions and proportion of enamel by focusing at specificc cross sections. Hypsodonty has often been defined using maximum height, but what van Dam, Fortuny and Ruijven claim is that the mean value could be a better indicator of diet. This value is calculated on the basis of the volume of the entire tooth crown, as modeled by computer software. Similarly, 2D enamel proportion in cross section is replaced by a 3D proportion calculated for the whole tooth. The innovation is two fold: first, the use of 3D scanning techniques, such as micro-CT, which allow to measure dental volumes with high precision. Second, the definition of two new dietary indices within one geometric framework 
Differences in hypsodonty (H) calculated as màximum or mean value for three of the analysed micromammals.A is the reference plain for orientation, and is used in the hypsodonty formula. Now it is time to further develop a database of species, as the first results show that, using this new method, the relative positions of taxa on the continuum between animal and plant consumers do change. Only some rodents and insectivores have been analysed so far, but the method can be applied to all mammals in principle. It seems that in other groups, such as primates, the correlation between hypsodonty and enamel thickness is weaker, because the dietary spectrum is not so broad as in micromammals, in which pure insect- or grass-consumers are included + info van Dam, J.A.,Fortuny, J. & van Ruijven, L.J. (2011). MicroCT-scans of fossil micromammalteeth: Re-defining hypsodonty and enamel proportion using true volume. Palaeogeography, Palaeoclimatology, Palaeoecology311: 303-310. |


